Asia Pacific - HVS Hotel Valuation Index
For a comprehensive review of the Asia Pacific market, click below:
HVS In-Depth Asia Pacific Hotel Valuation Index:
2026
|
2025
|
2022
|
2020
|
2018
|
2016
|
2009
|
2008
|
2007
|
2003
|
2001
|
2000
|
1999
The widespread impact of the coronavirus (COVID-19) has had an unprecedented impact on hotels and hotel values worldwide.
Consequently, the latest HVI analysis may no longer reflect the most current measure of lodging industry strength or the
hospitality investment market.
In each of our offices across the globe, we are working tirelessly to analyze the impact of recent events and provide timely
insights to help you navigate these uncharted waters. Because it is unclear how long the pandemic will last or how long related
restrictions will be in place, we are updating our analyses on a weekly basis using the most current data.
Additionally, examination of value trends in prior cycles can provide useful information. Historical patterns, together with
an understanding of the market’s current expectations for the eventual recovery of the industry and its performance, can provide
insights on the likely trajectory of decline and recovery for hotel values.
For the Latest Information and Analysis on the Impact of COVID-19Click Here
If you’d like to speak to someone personally to review details of our most current analysis, please don’t hesitate to contact
us directly.
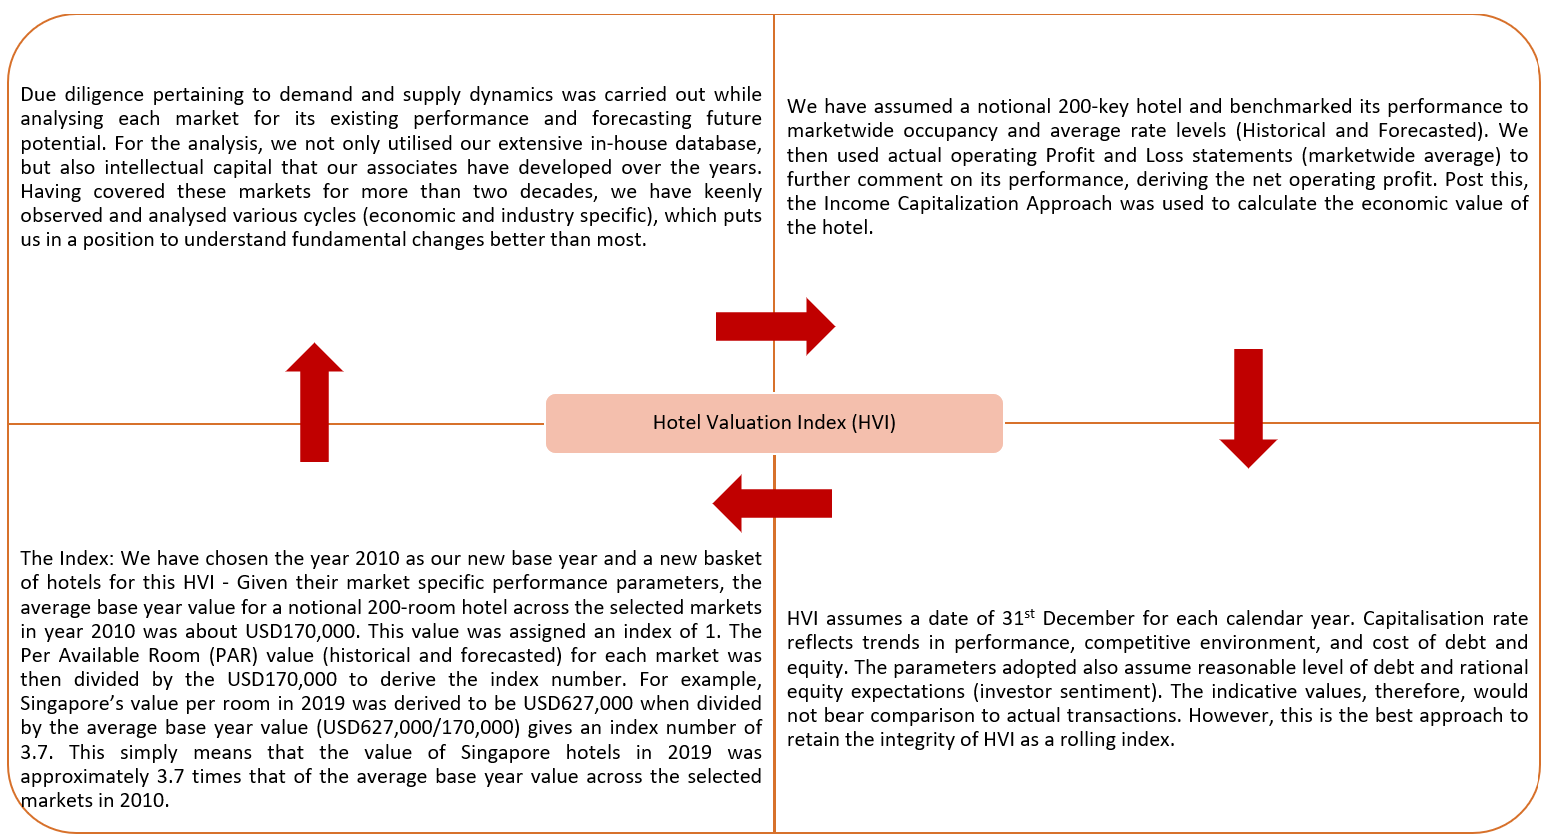
The Hospitality Valuation Index (HVI) combines the various factors affecting the economy and region at large with hotel market specific demand and supply dynamics to derive indicative values and future growth trends. For this edition of the HVI, we have analysed 18 key hotel markets across ten countries in Asia Pacific in the mid-market and higher space (four star plus).
Note:
-
To facilitate comparison between markets, we have calculated the index in USD. However, to understand the inherent growth within a market, sans currency fluctuation, we have also presented growth in values in terms of local currency for the historical years. The forecasted numbers, however, assumed an exchange rate, forecasted by the Economic Intelligence Unit, between the local currency and USD.
-
The HVI intends to create a platform where trends in hotel values are captured on an ongoing basis. We understand and appreciate the individual characteristics pertaining to each hotel asset. Therefore, it would be misrepresentative to look at a trend from the HVI and apply it to a specific asset. While this might give an indication of directional movement, for an investor or an owner, it is critical to capture hotel specific trends and factors to comment on its open market value.
-
The HVI does not consider appreciation or depreciation of real estate in a particular market neither does it account for changes in construction prices/indices. We have worked off a premise that a hotel asset’s value is derived from the income it can generate.
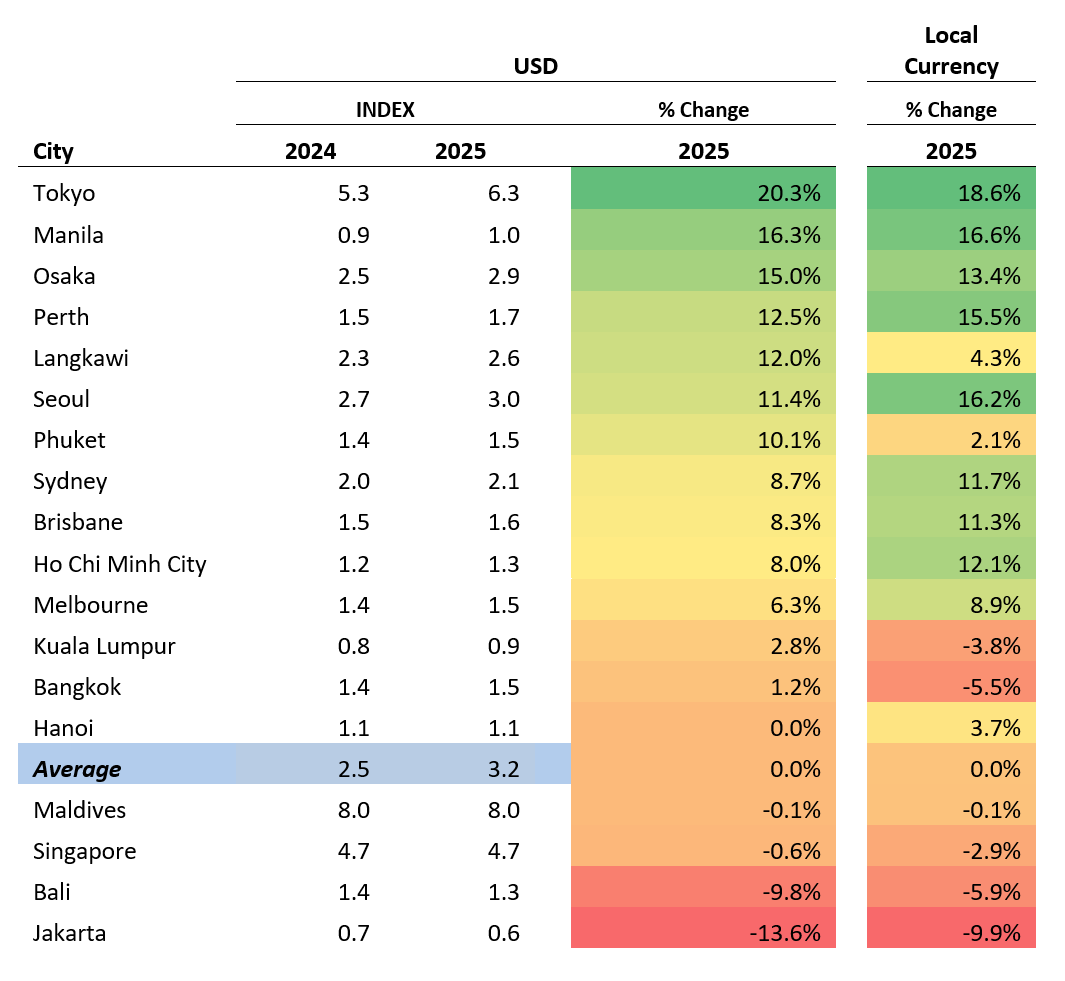
Historical - Valuation Trends by City:
Note:
-
Values are presented by % change in 2025 over 2024 in USD terms, highest to lowest.
-
Other than performance of the hotels, the index above has reflected the appreciation / depreciation of their respective local currency against the USD
-
Valuations for the Maldives were only performed in USD.
-
The three-color graded scale is based on the maximum, 50th percentile and minimum value.
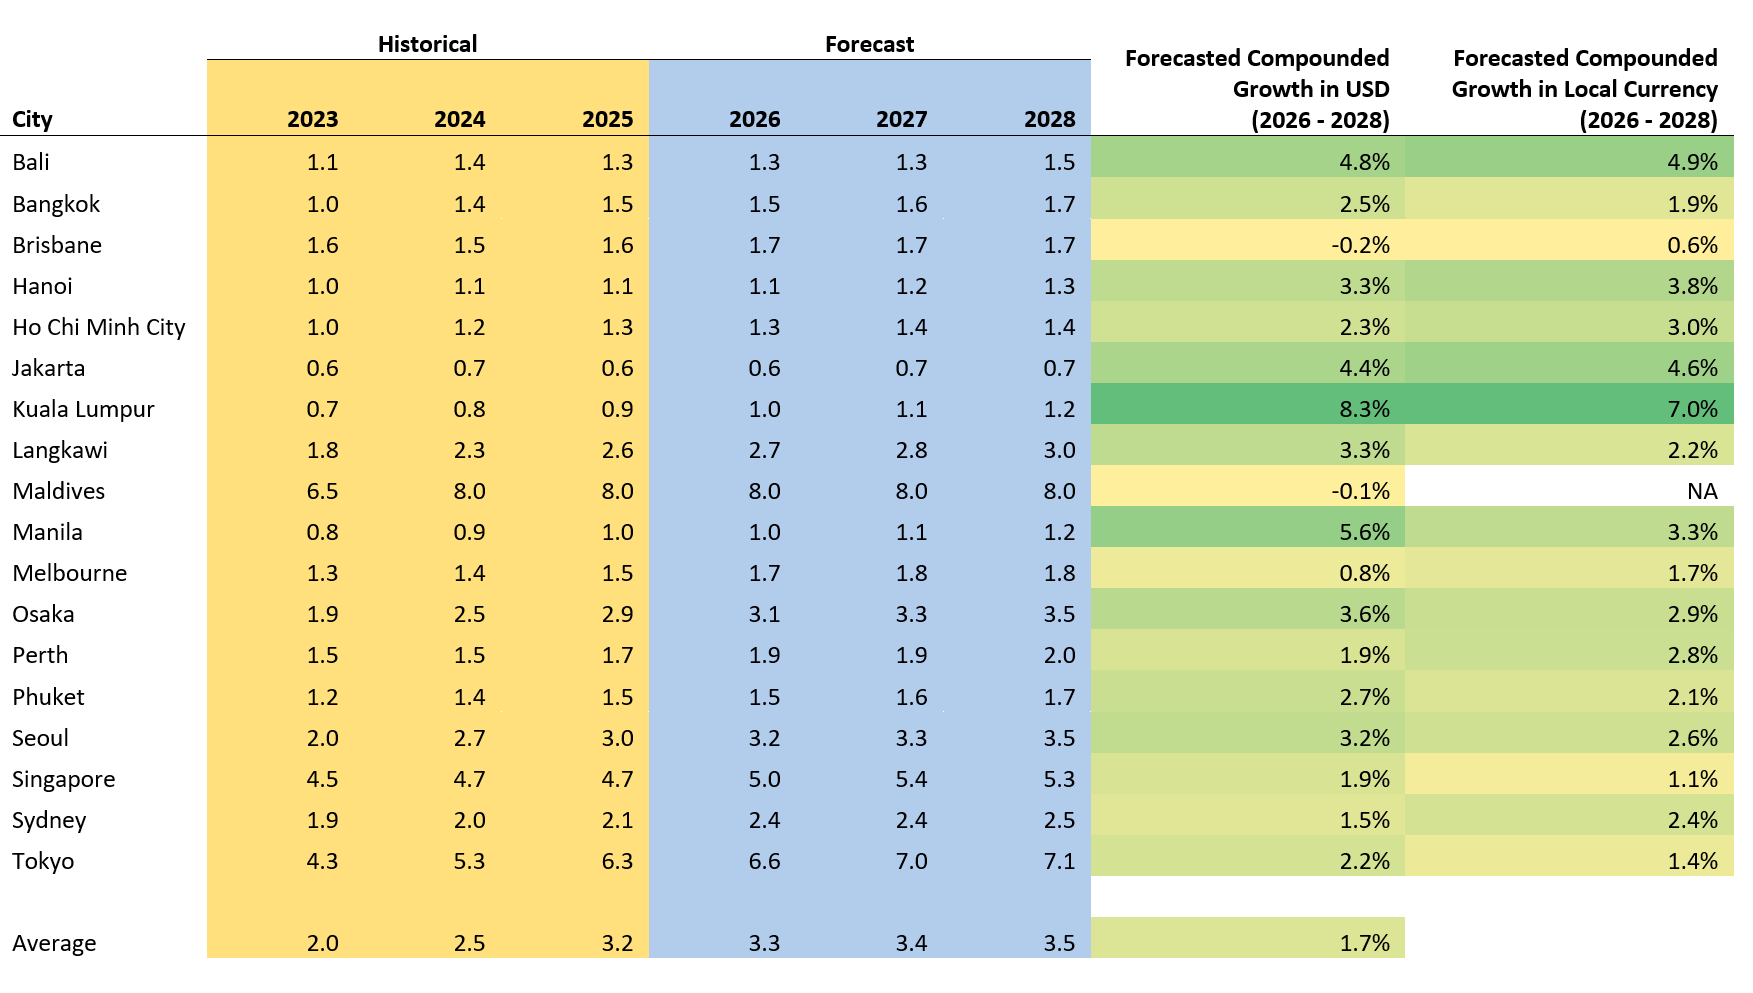
HVS Forecast - Hotel Valuation Index 2026 (USD):
Note:
-
HVS forecast as of March 2026.
-
The two-color graded scale is based on the maximum and minimum value.
Notable contributions were made by Chee Hok Yean, Chariss Kok, Isaac Ko, Jay Low, Mildred Sim and Vanessa Coralie Jaquemet.
Market Value Change
| Market |
2023 |
2024 |
2025 |
2026 |
2027 |
2028 |
| Bali |
Stable values
|
Significant value increase
|
Moderate value decline
|
Stable values
|
Moderate value increase
|
Significant value increase
|
| Bangkok |
Moderate value increase
|
Significant value increase
|
Stable values
|
Moderate value increase
|
Stable values
|
Moderate value increase
|
| Beijing |
N/A
|
|
|
|
|
|
| Brisbane |
Significant value increase
|
Moderate value decline
|
Moderate value increase
|
Moderate value increase
|
Stable values
|
Stable values
|
| Hanoi |
Significant value increase
|
Moderate value increase
|
Stable values
|
Moderate value increase
|
Moderate value increase
|
Moderate value increase
|
| Ho Chi Minh |
Significant value increase
|
Significant value increase
|
Moderate value increase
|
Moderate value increase
|
Moderate value increase
|
Moderate value increase
|
| Hong Kong |
N/A
|
|
|
|
|
|
| Jakarta |
Stable values
|
Significant value increase
|
Significant value decline
|
Moderate value increase
|
Moderate value increase
|
Moderate value increase
|
| Kuala Lumpur |
Moderate value decline
|
Significant value increase
|
Stable values
|
Significant value increase
|
Significant value increase
|
Moderate value increase
|
| Langkawi |
Significant value increase
|
Significant value increase
|
Significant value increase
|
Moderate value increase
|
Stable values
|
Moderate value increase
|
| Maldives |
Stable values
|
Significant value increase
|
Stable values
|
Stable values
|
Stable values
|
Stable values
|
| Manila |
Stable values
|
Moderate value increase
|
Significant value increase
|
Stable values
|
Moderate value increase
|
Moderate value increase
|
| Melbourne |
Significant value increase
|
Moderate value increase
|
Moderate value increase
|
Significant value increase
|
Stable values
|
Stable values
|
| Osaka |
Significant value decline
|
Significant value increase
|
Significant value increase
|
Moderate value increase
|
Moderate value increase
|
Moderate value increase
|
| Perth |
Significant value increase
|
Stable values
|
Significant value increase
|
Moderate value increase
|
Moderate value increase
|
Stable values
|
| Phuket |
Significant value increase
|
Significant value increase
|
Significant value increase
|
Stable values
|
Moderate value increase
|
Moderate value increase
|
| Seoul |
Moderate value increase
|
Significant value increase
|
Significant value increase
|
Moderate value increase
|
Moderate value increase
|
Moderate value increase
|
| Shanghai |
N/A
|
|
|
|
|
|
| Singapore |
Significant value increase
|
Moderate value increase
|
Stable values
|
Moderate value increase
|
Moderate value increase
|
Stable values
|
| Sydney |
Significant value increase
|
Stable values
|
Moderate value increase
|
Significant value increase
|
Stable values
|
Stable values
|
| Taipei |
N/A
|
|
|
|
|
|
| Tokyo |
Stable values
|
Significant value increase
|
Significant value increase
|
Moderate value increase
|
Moderate value increase
|
Stable values
|
Top 10 Previous Year
|
Bottom 10 Previous Year
|
Top 10 Current Year
|
Bottom 10 Current Year
|
Top 10 Next Three Years
|
Bottom 10 Next Three Years
|
|

